

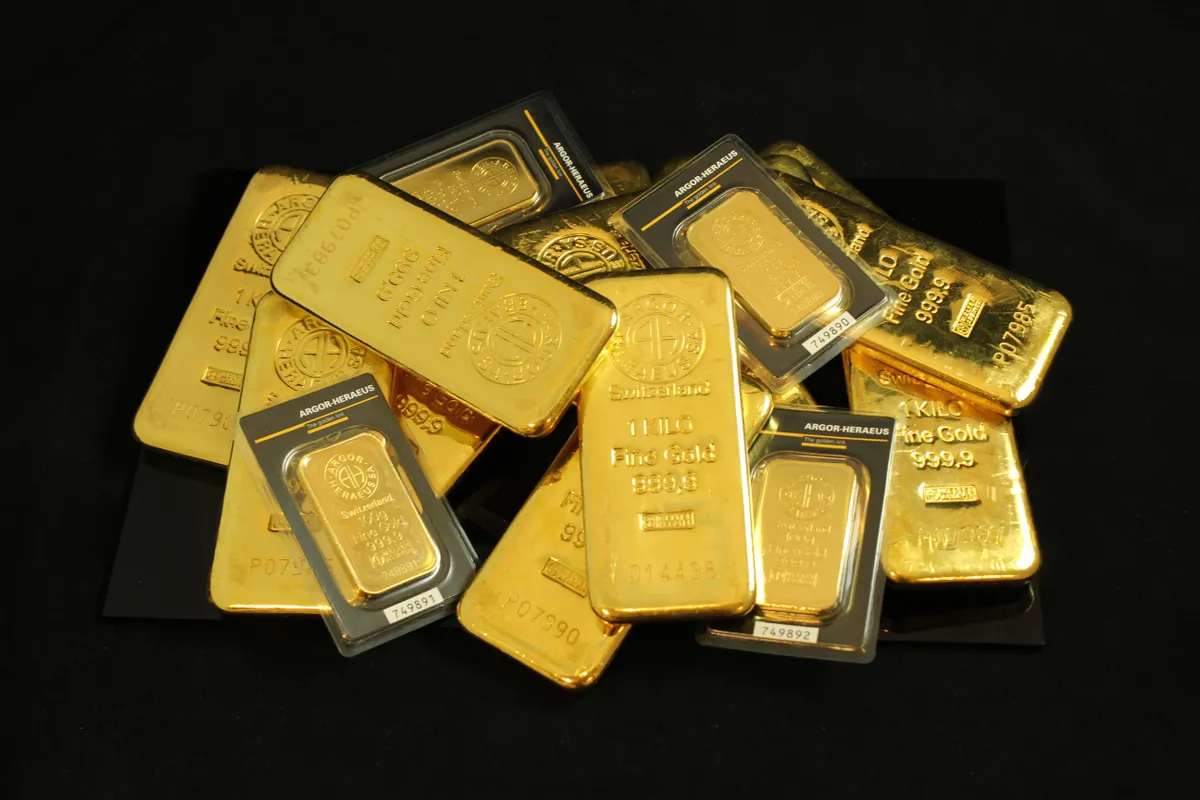

People’s Bank of China gold purchases have reached a record 20-month consecutive buying streak as of June 2026, making China’s central bank the dominant structural force in a precious metals market that has swung violently this year.
Gold’s wild 2026 ride in context
Gold set 12 all-time highs in the first half of 2026 before pulling back hard, according to the World Gold Council’s Gold Mid-Year Outlook 2026. The metal surged above $5,500/oz in January, fell below $4,000 in late June, and now trades at around $4,055. Despite being roughly 7% lower year-to-date at mid-2026, it has outperformed most major asset classes over the past 12 months.
The last comparable crash came in 1979–80, when gold climbed from around $220 to $850 before falling by more than half within months, as the US Federal Reserve raised rates aggressively and inflation expectations eased. The World Gold Council notes that the first half of 2026 showed gold remains sensitive to heightened geopolitical concerns and abrupt shifts in investor sentiment. One former investment specialist observes that it has been trading more like a risk asset, moving in line with real rates rather than acting as a safe haven.
The People’s Bank of China gold buying streak: 20 months and counting
The People’s Bank of China gold buying streak has now run for 20 consecutive months, the longest on record since comparable data began in 1999, confirmed by both the World Gold Council’s China Gold Market Update for July 2026 and Nikkei Asia. In June alone, the PBoC acquired 15 tonnes, its largest single monthly purchase since October 2023, bringing China’s total official gold holdings to 2,346 tonnes.
The original report described those People’s Bank of China gold reserves as equating to “almost 10%” of total foreign exchange assets. The World Gold Council’s own July 2026 update puts the figure at 8% as of end-June 2026; that primary-source figure is the one to use.
JP Morgan Wealth Management’s global investment strategy group forecasts gold ending 2026 between $4,350 and $4,650, compared with the current level of $4,055. The World Gold Council’s scenario analysis points to similar territory: a worsening economy, renewed geopolitical shock, or a wave of dip-buying could push gold back towards $4,500 or higher. Resilient growth, rising yields, and quieter markets could push it lower, though a fall of more than 10% from current levels may attract bargain-hunters.
Record value, but demand is splitting in two
H1 2026 total gold demand, including over-the-counter (OTC) transactions (direct off-exchange trades between institutions), reached 2,522 tonnes, up 2% year-on-year, generating a record value of $380 billion, according to the World Gold Council’s Gold Demand Trends Q2 2026 report.
Q1 was the stronger half of that pair. The Gold Demand Trends Q1 2026 report recorded 1,231 tonnes with a record quarterly value of $193 billion, a 74% jump year-on-year. Bar and coin demand hit 474 tonnes, up 42% year-on-year and the second highest quarter on record, led by Asian retail investors. Central banks added 244 tonnes on a net basis in Q1 alone.
Q2 told a different story. Total demand held steady at 1,269 tonnes year-on-year, but jewellery volumes fell to 278 tonnes, the lowest quarterly total since the pandemic. Gold ETFs (exchange-traded funds that track the gold price) saw outflows of 45 tonnes in Q2, suggesting institutional sellers were taking profits at elevated prices.
Meanwhile, Shanghai Gold Exchange wholesale withdrawals dropped to just 64 tonnes in May 2026, down 38% month-on-month and at lows unseen for 16 years, according to a USAGOLD report citing World Gold Council analysis. The PBoC was buying aggressively while domestic Chinese physical demand softened, a divergence that complicates any simple reading of China as an undifferentiated source of gold appetite.
Silver: off its peak, but still well above last year
Silver peaked at $120/oz in early 2026, has since fallen back to around half that level, yet remains roughly 70% above where it traded 12 months ago. The January peak was widely regarded as unsustainable: industrial users accelerated recycling programmes and cut consumption where possible.
Solar panel manufacturing accounts for around one-fifth of total silver demand. Producers have reduced silver per cell by printing finer conductive lines and refining cell designs, but this “thrifting” has not kept pace with rising production volumes.
Nitesh Shah, Head of Commodities and Macroeconomic Research at WisdomTree Europe, sees the supply deficit continuing but narrowing. ‘While silver remains in a supply deficit, the scale of that deficit appears to be narrowing, and we do not anticipate excessive tightening from current levels,’ he says. WisdomTree’s central case is for silver to rise towards $70 by Q2 2027, mainly driven by higher gold prices. Shah adds: ‘However, some increase in production, alongside more moderate industrial demand growth, is likely to cap the upside.’
Faith-based funds: the label is not the strategy
More than four billion people identify with Christianity or Islam, giving faith-based investing a theoretically large addressable market. In practice, the sector has underdelivered. These funds tend to carry higher fees, offer few passive options, and have underperformed conventional alternatives. There is also no single agreed definition of what qualifies a fund as faith-consistent.
Shariah-compliant funds have fared better over recent years, largely because avoiding financial-sector stocks leaves them overweight in technology. Christian funds have often excluded healthcare names that turned out to be strong performers.
Morningstar analyst Michael Born argues that the label should be treated as a starting point, not a guarantee. ‘In a market this heterogeneous, the burden falls on the investor to verify that a strategy genuinely reflects their own beliefs, rather than assuming that a shared label guarantees alignment,’ he says. He recommends examining the screening methodology and sector tilts, and adds that ‘fees should be scrutinised relative to conventional alternatives (particularly for passive products), and investors should weigh the still-limited track records and sample sizes of many strategies before drawing firm conclusions on performance or resilience.’
The universe does offer enough breadth for a retirement portfolio, but it skews heavily towards global equity strategies. Specific geographic allocations, specialist strategies, and alternatives are thin on the ground. For ISA or SIPP investors drawn to this space, understanding that gap before committing capital is the first practical step.
